8 comments
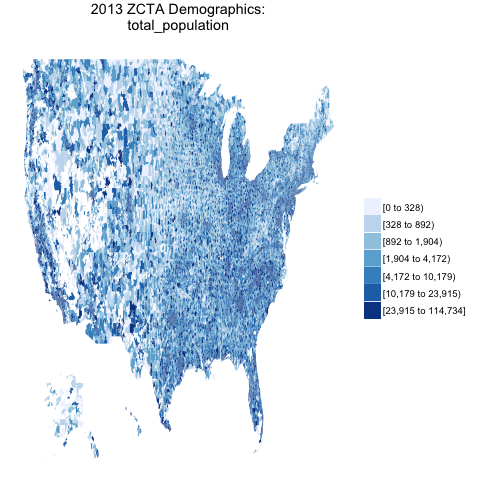
Can you fix the aspect ratio so the US doesn’t look that squashed?
Thank you for the comment.
I’m working on it. But unfortunately the most natural way of fixing it (adding + geom_map()) crashes my system. See here for details: https://groups.google.com/forum/#!topic/choroplethr/PfN5eqtLlgs
This is an awesome package and I am already enjoying using it. Thank you for the work. More examples on color scaling (different quantiles) and also getting flatter shaped maps would help choropleth newbies like me.
Thank you for your comment. There are a few vignettes on the main choroplethr page which go thru changing the colors:
https://github.com/arilamstein/choroplethr
You might be particularly interested in the state choropleth vignette, because it shows dealing with string/factor values (presidential candidates):
http://cran.r-project.org/web/packages/choroplethr/vignettes/b-state-choropleth.html
If you type:
> library(choroplethr)
> ?state_choropleth
You will see an example of creating a choropleth which shows which states have less than or more than 1 million people. Essentially, it converts the numeric values (population) to string/factor (e.g. ” 1M”) before calling state_choropleth().
The projection issue is something that I’m working now. For whatever reason, R crashes when I try to manually set a projection. See here for details:
https://groups.google.com/forum/#!topic/choroplethr/PfN5eqtLlgs
If you have any specific questions, the best place to get help is the choroplethr google group:
Appreciate it! I need to and am using the zip level one from one of your other vignettes with state_zoom. It works great for palette=5, but the scale_color_brewer seems to pick certain quantiles of the data. I need to modify them to scale the data differently. This may be more a ggplot2 related issue and not the choroplethrzip one. But, I just can’t seem to get it.
Gopala,
Please post a reproducible example on the choroplethr google group:
https://groups.google.com/forum/#!forum/choroplethr
I will see what I can do to get you the result you need.
Ari
Ari- This tool looks amazing! Am having trouble installing the zip code level data in R. Receiving the following error: ERROR: dependency ‘Hmisc’ is not available for package ‘choroplethrZip’
Any suggestions on how to bypass this error? Sorry for the rudimentary question.
Can you confirm which version of choroplethrZip you’re trying to install. This post is for v1.3.0 but the current version is v1.5.0. See https://github.com/arilamstein/choroplethrZip

