
Choroplethr v3.6.2 is now on CRAN
A new version of Choroplethr is now on CRAN! You can get it by typing the following from the R Console:
install.packages("choroplethr")
I encourage all Choroplethr users to install this new version!
Overview
A new version of ggplot2 will be released shortly. This new version of ggplot2 introduces many new features. These new features, however, come at a cost: some packages which use ggplot2 (such as Choroplethr) are not compatible with this new version.
In fact, if you try to draw a map with the new version of ggplot2 and the old version of Choroplethr, you might get an error. This new version of Chorplethr (v3.6.2) fixes those issues.
Technical Details
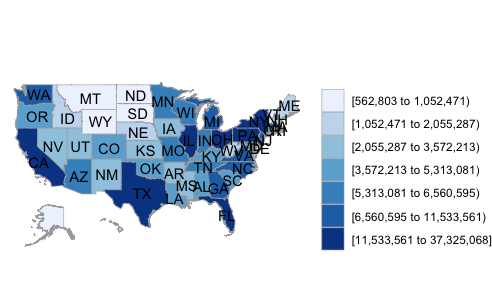
Choroplethr was one of (if not the) first R package to create maps of the US where Alaska and Hawaii are rendered as insets. Here’s an example map, along with code:
library(choroplethr)

data(df_pop_state)

state_choropleth(df_pop_state)
The new version of ggplot2 was causing Choroplethr to crash whenever it attempted to render the above map. In order to understand the underlying issue, it is helpful to first understand how Choroplethr creates the above map.
Insets and ?annotation_custom
The most important thing to notice about the above map is this: it is inaccurate.
Alaska and Hawaii are not really located where they appear. And they are not drawn to scale, either.
Here is how the 50 US states “really” look:
library(choroplethrMaps)
library(ggplot2)

data(state.map)
ggplot(state.map, aes(long, lat, group=group)) + geom_polygon()

In order to render Alaska and Hawaii as insets, Choroplethr:
- First pre-renders the Continental US, Alaska and Hawaii as separate ggplot objects.
- Then affixes the Alaska and Hawaii ggplot objects to the continental US object using ggplot2’s ggplotGrob and annotation_custom functions.
Insets and Themes
The two images differ in more than just the placement of Alaska and Hawaii, though. The first map also has a clear background, whereas the second map has a grey background and tick marks for longitude and latitude. Also, Choroplethr uses a single legend for all three maps (the legends for Alaska and Hawaii are suppressed).
Traditionally Choroplethr has implemented these aesthetic tweaks in the functions theme_clean (for the Continental US) and theme_inset (for Alaska and Hawaii). The code for these functions originally came from Section 13.19 (“Making a Map with a Clean Background”) of Winston Chang’s R Graphics Cookbook. Here’s what that code used to look like:
    theme_clean = function()
    {
      theme(
        axis.title        = element_blank(),
        axis.text         = element_blank(),
        panel.background  = element_blank(),
        panel.grid        = element_blank(),
        axis.ticks.length = unit(0, "cm"),
        panel.spacing     = unit(0, "lines"),
        plot.margin       = unit(c(0, 0, 0, 0), "lines"),
        complete          = TRUE
      )
    },

    theme_inset = function()
    {
      theme(
        legend.position   = "none",
        axis.title        = element_blank(),
        axis.text         = element_blank(),
        panel.background  = element_blank(),
        panel.grid        = element_blank(),
        axis.ticks.length = unit(0, "cm"),
        panel.spacing     = unit(0, "lines"),
        plot.margin       = unit(c(0, 0, 0, 0), "lines"),
        complete          = TRUE
      )
    }
The Bug
The bug was happening when Choroplethr was attempting to affix the map of Alaska, with theme_inset applied to it, to the map of the Continental US:
# omit code for creating continental.ggplot
ret = continental.ggplot

# omit code for creating alaska.ggplot

# add alaska.ggplot to ret using ggplotGrob and annotation_custom
alaska.grob = ggplotGrob(alaska.ggplot)
ret = ret + annotation_custom(grobTree(alaska.grob), xmin=-125, xmax=-110, ymin=22.5, ymax=30)
The last line in the above snippet was causing Choroplethr to crash. It appears that the intersection of theme_inset, ggplotGrob and annotation_custom was causing a problem.
The Fix
It appears that ggplot2 has a new function for creating a clear background on a map that does not cause these problems. That function is theme_void. Modifying theme_clean and theme_inset to use theme_void solved the problem. Here is the new version of those functions:
theme_clean = function()
{
    ggplot2::theme_void()
}

theme_inset = function()
{
    ggplot2::theme_void() %+replace%
        ggplot2::theme(legend.position = "none")
}