
Creating Interactive Choropleths with Streamlit
Last week I published version 1.0 of my first project using Streamlit. The app is a simple “Census Explorer” that lets users select a state and demographic statistic, and then publishes the data as both a table and a map. Here is how version 1.0.0 of the app looked:
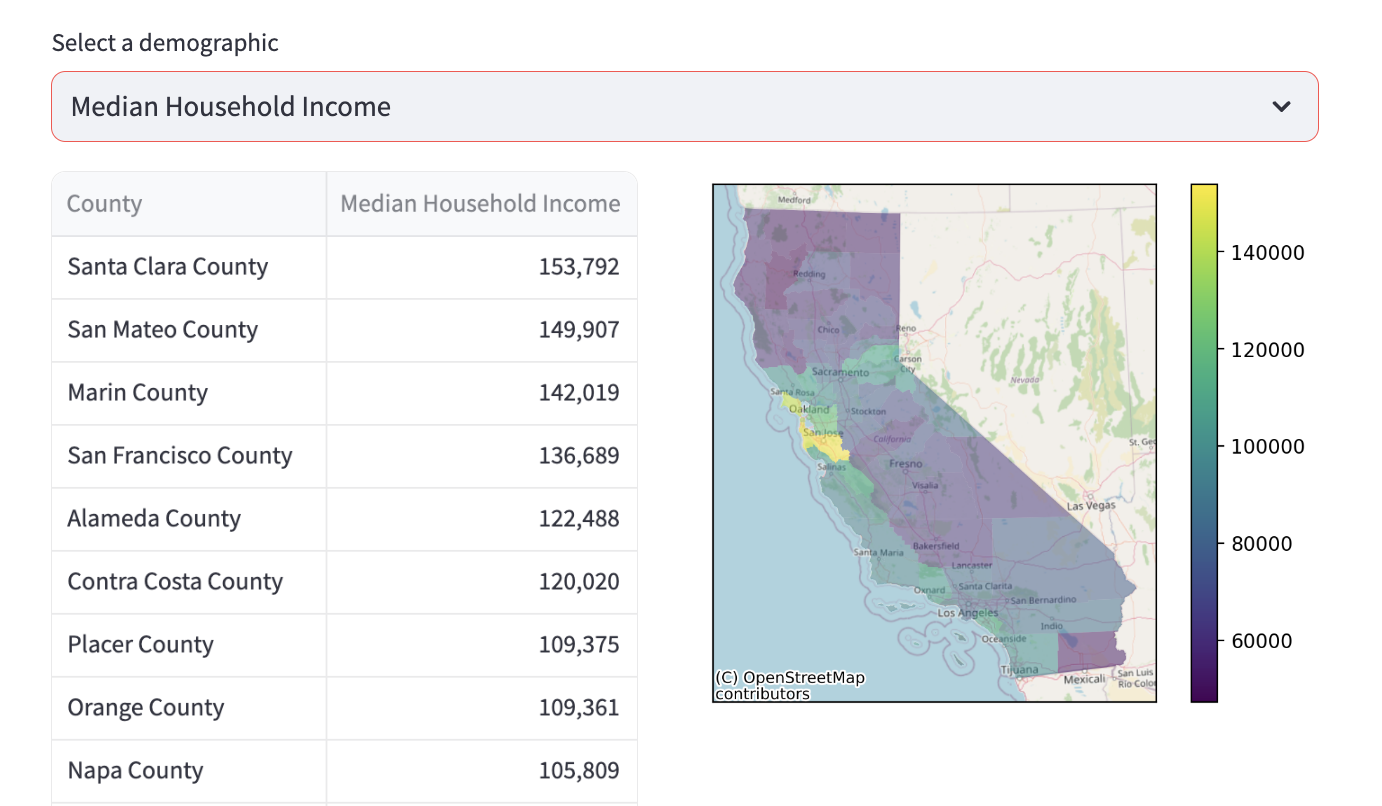 Unfortunately, this map suffers from a common problem with choropleth maps. Namely, the map clearly shows a cluster of high value counties. But it’s not possible to see how many counties are in that cluster, or what their names are. The most obvious solution would be to make the map interactive, so you could zoom in and see county name information on rollover or click.
Unfortunately, this change wound up being much harder to implement than I would have liked! A google search made it clear that lots of people have had this problem over the years. But there was no consensus solution, and some of the posted solutions simply did not work for me.
Thankfully Ramnath Vaidyanathan recommended an approach that did work for me. He recommended that I create the choropleth via plotly’s px.choropleth function, and then feed that map to streamlit using st.plotly_chart. (Previously I was trying to use st.map, which sounds logical because I’m generating a map. But it appears to simply not do what I want in this case). The final code looked like this:
import streamlit as st
import plotly.express as px

fig = px.choropleth(df, geojson=df.geometry, locations=df.index, color=var_label, color_continuous_scale="Viridis", projection="mercator")
fig.update_geos(fitbounds="locations", visible=False)

st.plotly_chart(fig)
If you are on this page because you have this exact same problem you might want to know more details, such as the structure of df. To help you I have tagged the actual code I used as v1.1.0 in my repo, so you can walk through the entire app yourself. Click here to view the file.
New Version of the App
After implementing this feature I decided to publish a new version of the app. You can view it by clicking here or clicking the image below, which is a screenshot of the current version of the app.
