2 comments
Hmm… your shiny app is not existing:
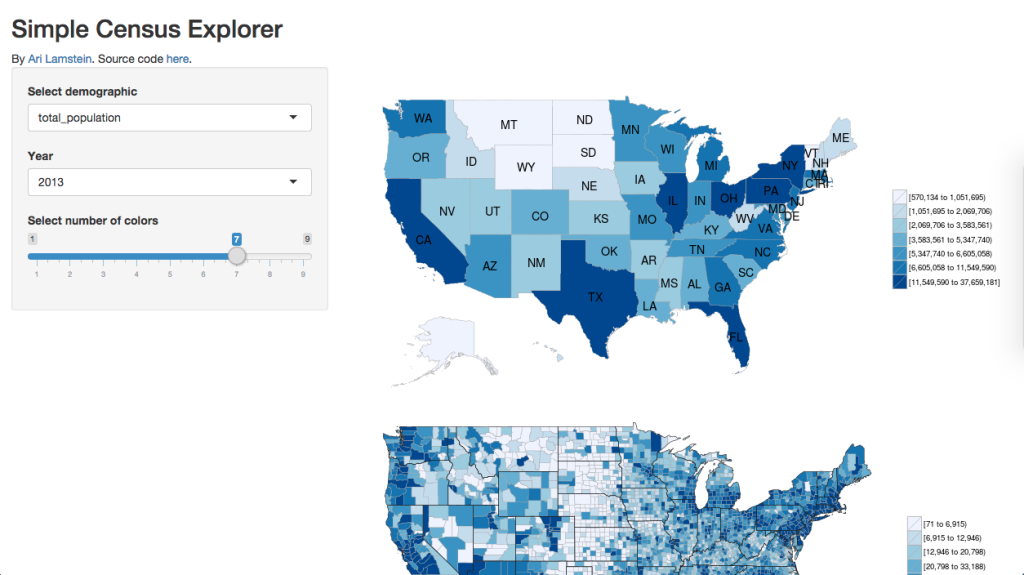
https://arilamstein.shinyapps.io/shiny-statistical-maps
the US Census Bureau’s API key also doesn’t work.
Here is the error message after running api.key.install() and submitting ?get_county_demographics:
> ?get_county_demographics
No documentation for ‘get_county_demographics’ in specified packages and libraries:
you could try ‘??get_county_demographics’
I took the shiny app down because my hosting bill got too expensive. I’m in the process of trying to find cheaper hosting options.
get_county_demographics is part of the choroplethr package. So try typing:
library(choroplethr)
?get_county_demographics should work.
If you have an interest in this material I recommend taking my free course “Learn to Map Census Data in R”: https://arilamstein.com/free-course/. It walks you through each of these steps and if you have questions you can just click “reply” on the emails to ask me.

