Today I will demonstrate how to remove state abbreviations from a choroplethr map. I will also demonstrate how to combine multiple maps into a single image. This is what the final image looks like:
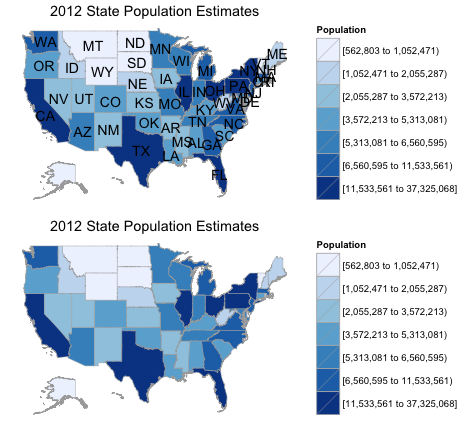
In this case the abbreviations obscure information for the northeast part of the country, so it’s useful to remove them.
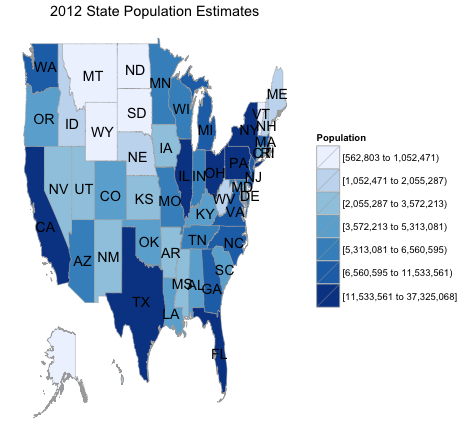
Step 1: Create a Map With Abbreviations
The map with abbreviations is fairly straightforward to create. In fact, it is very similar to the map created in the first lesson of my course Learn to Map Census Data in R. Let’s create the map, render it, and then save it as a variable:
library(choroplethr)
library(choroplethrMaps)

data(df_pop_state)
with_abbr = state_choropleth(df_pop_state,
                title = "2012 State Population Estimates",
                legend = "Population")

with_abbr
Step 2: Learn About Object-Oriented Choropleths
To make the map without abbreviations we need to use the object oriented features of choroplethr. This is much easier than it sounds; in fact, all that the function state_choropleth does is create a StateChoropleth object:
> state_choropleth
function (df, title = "", legend = "", num_colors = 7, zoom = NULL)
{
    c = StateChoropleth$new(df)
    c$title = title
    c$legend = legend
    c$set_num_colors(num_colors)
    c$set_zoom(zoom)
    c$render()
}
If this type of code is new to you, then I recommend taking a few minutes to run it yourself from an R command line.
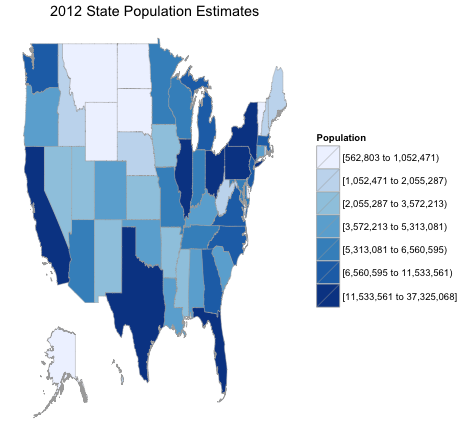
Step 3: Create a Map Without Abbreviations
The StateChoropleth object has a member variable called show_labels, which defaults to TRUE. You can see it in the source code here. If we set it to FALSE before calling render() then the map will render without labels.
c = StateChoropleth$new(df_pop_state)
c$title = "2012 State Population Estimates"
c$legend = "Population"
c$set_num_colors(7)
c$set_zoom(NULL)
c$show_labels = FALSE
without_abbr = c$render()

without_abbr
Step 4: Merge the Maps
A common task when doing data analysis is to compare two maps side by side. We can accomplish this with the grid.arrange function in the gridExtra package:
library(gridExtra)
grid.arrange(with_abb, without_abb)
In Other News
- Vivek Patial was kind enough to mention choroplethr in his recent talk Display of Geographic Data in R.
- I have been mentioning for a while that I want to create an online course. As a concrete step in that direction I created my first YouTube video: How to Make a State Choropleth Map in R. Feedback is welcome!
- KDnuggets, one of the top data mining blogs, was kind enough to cover my free course “Learn to Map Census Data in R”.
