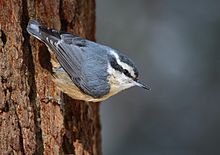
The bird in question. But where does it live? Credit: Wikipedia.
After releasing my course Mapmaking in R with Choroplethr last December I received an interesting email from Dr. Herb Wilson, a biologist at Colby College. Herb studies the Red-breasted Nuthatch, which live throughout the United States and Canada. He asked if it was possible to use choroplethr to map the location of these birds. Herb’s data was a list of (region, value) pairs, where the regions are US States and Canadian Provinces.
At that time it was possible to use the function ?admin1_choropleth to map the birds in US States or Canadian Provinces, but not both simultaneously. So I created a new function for him, ?admin1_region_choropleth, which solves this exact problem.
The code is now on CRAN. Below is a tutorial on how to use it.
The Code
To get the latest version of choroplethr, simply install it from CRAN and check its version:
install.packages("choroplethr")
packageVersion("choroplethr")
[1] ‘3.5.0’
If you see a lower version (for example 3.4.0), then you need to wait a day or two until your CRAN mirror updates.
The new function is called admin1_region_choropleth. You can see its built-in help like this:
library(choroplethr)
?admin1_region_choropleth
The Data
The bird count data comes from the annual Christmas Bird Count run by the National Audubon Society. I have put it in a github repository which you can access here. Once you download the file you can read it in like this:
library(readr)
rbn = read_csv("~/Downloads/rbn.csv")
head(rbn)
Source: local data frame [6 x 8]
  State AdminRegion Count_yr SpeciesNumber NumberByPartyHours  Year ReportingCounts ReportingObservers
  (chr)       (chr)    (int)         (int)              (dbl) (int)           (int)              (int)
1    AK      alaska       63             1             0.0128  1962               1                  1
2    AK      alaska       64             2             0.0233  1963               1                  2
3    AK      alaska       70             6             0.0513  1969               2                  8
4    AK      alaska       71             4             0.0313  1970               1                  7
5    AK      alaska       72             2             0.0187  1971               2                 18
6    AK      alaska       73             3             0.0328  1972               2                 13
If we wanted to map the NumberByPartyHours in 2013 we could start like this:
library(dplyr)
rbn2013 = rbn %>%
          rename(region = AdminRegion, value = NumberByPartyHours) %>%
          filter(Year == 2013 & !region %in%c("yukon territories", "alaska", "northwest territories"))
We rename the columns to region and value because choroplethr requires columns with those names. We filter out Alaska and the Northwest Territores because they visually throw off the map a bit, and might look nicer as insets.
Making the Map
To make the map, simply pass the new data frame to the function admin1_region_choropleth:
library(choroplethrAdmin1)
library(ggplot2)
admin1_region_choropleth(rbn2013,
    title  = "2013 Red-breasted Nuthatch Sightings",
    legend = "Sightings By Party Hours") + coord_map()
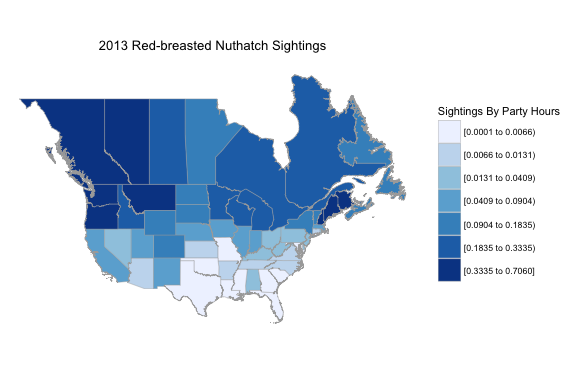
And now the visual pattern of the data is clear. Within North America, the Red-breasted Nuthatch has been seen mostly in the northwest and northeast.
Updating the Course
This is the third update I’ve made to choroplethr since launching my course Mapmaking in R with Choroplethr last December. (You can learn about the other updates here and here.) My plan is to update the course with video lectures that demonstrate this material soon. But that will probably have to wait until I finish production of my next course, which I hope to announce soon.
