
Choroplethr v3.6.0 is now on CRAN
Choroplethr version 3.6.0 is now on CRAN. This version adds functionality for getting and mapping demographics of US Census Tracts. You can install it from the R console as follows:
install.packages("choroplethr")
packageVersion("choroplethr")
[1] ‘3.6.0’
To use this functionality you will need an API key from the US Census Bureau. You can learn more about that here.
[content_upgrade cu_id=”5608″]Bonus: Download the code in this post![content_upgrade_button]Click Here[/content_upgrade_button][/content_upgrade]Getting Tract Maps
Historically choroplethr has had limited support for Census Tracts. This is because the US Census Bureau releases tract maps on a per-state basis, and it wasn’t feasible to create a separate package for each state.
Choroplethr now uses the tigris package to download Tract maps from the Census Bureau on demand. The function to retrieve a map is get_tract_map. Here’s an example of retrieving and rendering a map of Tracts in New York:
library(choroplethr)
library(ggplot2)

?get_tract_map
ny = get_tract_map("new york")
ggplot(ny, aes(long, lat, group=group)) + geom_polygon()

Getting Tract-Level Demographics
Choroplethr contains both maps and interesting data to map. If you want to explore the demographics of US Census Tracts then use get_tract_demographics:
# see help for extra options
?get_tract_demographics

ny_stats = get_tract_demographics("new york")
head(ny_stats)
region      total_population percent_white percent_black percent_asian percent_hispanic per_capita_income median_rent median_age
36001000100 2163             19            57            2             19               19065             596         36.9
36001000200 5335             9             72            0             13               15376             501         27.8
36001000300 6077             35            44            3             17               20804             743         31.0
36001000401 2380             88            7             2             2                39574             1198        65.5
36001000403 4338             65            19            11            5                32397             859         41.9
36001000404 4932             69            12            7             9                2479              NA          19.6
Creating Choropleth Maps
Now that we have a map and spatial data, we can create a choropleth map with the function tract_choropleth.
Recall that all choroplethr functions require a dataframe where one column is called “region” and one column is called “value”. get_tract_demographics returns a dataframe with a “region” column and eight demographic values. We still need to create a “value” column. Let’s go with median_rent:
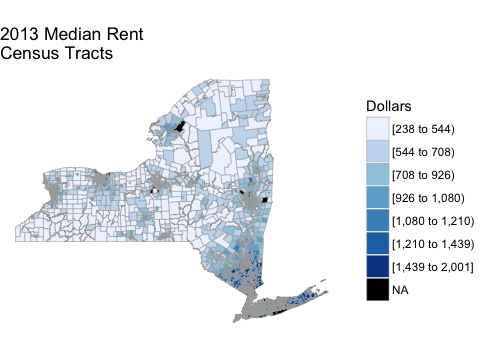
ny_stats$value = ny_stats$median_rent

?tract_choropleth
tract_choropleth(ny_stats, "new york", title = "2013 Median Rent\nCensus Tracts", legend="Dollars")
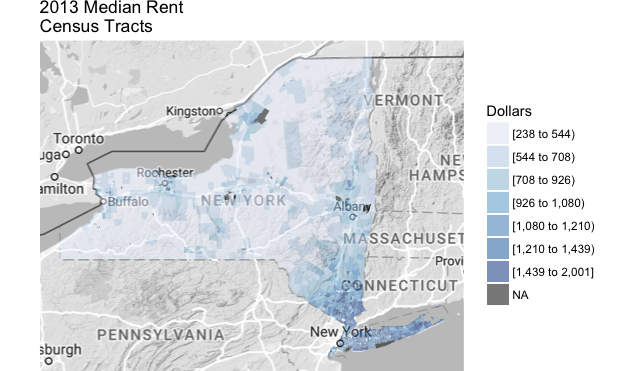
People not familiar with New York might see the above map and not know where major landmarks are. To solve this problem, all choroplethr functions have a “reference_map” parameter, which puts a google map underneath the choropleth:
tract_choropleth(ny_stats, "new york", title = "2013 Median Rent\nCensus Tracts", legend="Dollars", reference_map = TRUE)
Zooming in
Tract maps of an entire state are hard to view because the tracts are so small. This is why all tract-related functions in choroplethr allow you to zoom by county.
In addition to being useful for viewing maps, the county-zoom option is useful for get_tract_demographics because getting tract-level demographics for an entire state is slow.
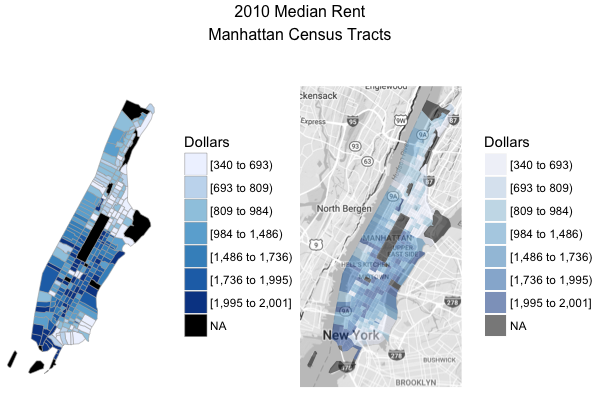
Note that counties must be specified by their county FIPS code. Here’s an example of zooming in on Manhattan (FIPS code 36061):
# 36061 is the FIPS code for New York county (i.e. Manhattan)
manhattan_2010 = get_tract_demographics("new york", county_fips=36061, endyear = 2010, span = 5)
manhattan_2010$value = manhattan_2010$median_rent

m1 = tract_choropleth(manhattan_2010, "new york", legend = "Dollars", county_zoom = 36061)
m2 = tract_choropleth(manhattan_2010, "new york", legend = "Dollars", county_zoom = 36061, reference_map = TRUE)

?double_map
double_map(m1, m2, "2010 Median Rent\nManhattan Census Tracts")
New function: double_map
As the above example shows, v3.6.0 introduces a new function: double_map.
In my own work I find that frequently switch between viewing a pure choropleth (where the color contrast is strong) and a choropleth + reference map (where the reference map helps you understand what you’re looking at). double_map simply encapsulates some code for putting two maps side-by-side
Caveats
There are a few things to keep in mind when using this functionality:
- get_tract_demographics returns data from the American Community Survey (ACS). The ACS provides estimates with a margin of error (MOE). In the case of tracts, the MOE can be quite large. tract_choropleth does not attempt to visualize the MOE.
- get_tract_demographics sometimes produces the warning “NAs introduced by coercion”. I assume that this occurs when the ACS simply does not return an estimated value for a tract. (E.g. a sparsely populated, or unpopulated tract). However, I have not investigated this.
- tract_choropleth sometimes produces the warning “Your data.frame contains the following regions which are not mappable”. This is a bit of a mystery for me. It indicates that get_tract_demographics (which gets data from the Census API) contains regions which are not part of a map (that also comes from the Census API).
- tract_choropleth sometimes produces the warning “The following regions were missing and are being set to NA”. Presumably these regions are the same regions as in (2).