Choroplethr v3.6.4 is now on CRAN. This is the first update to the package in two years, and was necessary because of a recent change to the tigris package, which choroplethr uses to make Census Tract maps. I also took this opportunity to add new example demographic data for Census Tracts.
Quick Demo
The first new dataset is ?df_pop_ny_tract, which contains 2012 population estimates for all Tracts in New York State. Here is an example of mapping the data:
install.packages("choroplethr")
library(choroplethr)
data(df_pop_ny_tract)

tract_choropleth(df_pop_ny_tract,
                 state_name = "new york",
                 title      = "NY State Tract Population Estimates (2012)",
                 legend     = "Population")
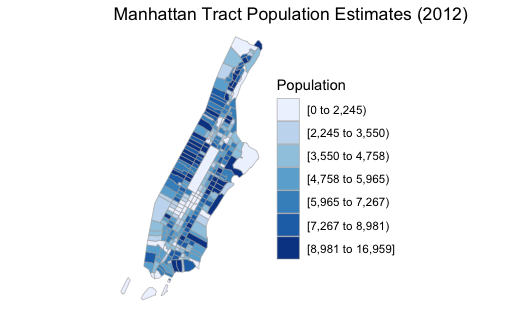
 There are a total of 4,918 Census Tracts in New York State. As you can see, viewing them all at once isn’t very useful. My hope is that one day Choroplethr will also support interactive maps, which might make statewide Tract maps more useful. Until then, I recommend using the county_zoom parameter. This parameter requires a County FIPS Code. Here’s an example of zooming in on Manhattan, which has the FIPS Code 36061:
tract_choropleth(df_pop_ny_tract,
                 state_name  = "new york",
                 county_zoom = 36061,
                 title       = "Manhattan Tract Population Estimates (2012)",
                 legend      = "Population")
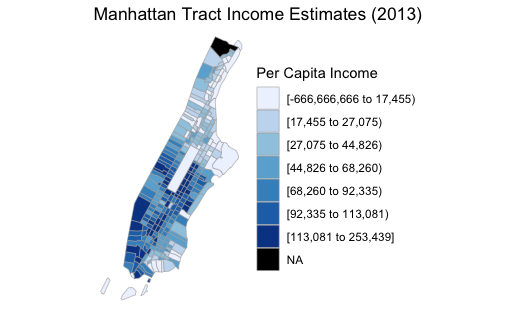
 The second dataset I added is ?df_ny_tract_demographics, which contains 8 demographic variables for Census Tracts in NY from 2013. Here is how to map Per Capita Income in Manhattan. Note that like all choroplethr functions, tract_choropleth requires a data.frame with one column named region and one column named value. df_ny_tract_demographics does not come with a column named value, so we must set it ourselves.
data(df_ny_tract_demographics)

df_ny_tract_demographics$value = df_ny_tract_demographics$per_capita_income

tract_choropleth(df_ny_tract_demographics,
                 state_name  = "new york",
                 county_zoom = 36061,
                 title       = "Manhattan Tract Income Estimates (2013)",
                 legend      = "Per Capita Income")
Exploratory Data Analysis
One of the main goals with choroplethr is to faciliate the exploration of the Census Bureau’s American Community Survey (ACS). If you want to explore Tract level demographics outside of New York’s 2013 data, then use the function ?get_tract_demographics. Here is an example of comparing the variables percent_white and percent_black in Chicago (Cook County, Illinois – FIPS Code 17031).
df_chicago_tract_demographics = get_tract_demographics("illinois", 17031, 2018, 5)

# create and store the % white map
df_chicago_tract_demographics$value = df_chicago_tract_demographics$percent_white
chicago_percent_white = tract_choropleth(df_chicago_tract_demographics,
                 state_name="illinois",
                 county_zoom=17031,
                 title="",
                 legend="Percent White")

# create and store the % black map
df_chicago_tract_demographics$value = df_chicago_tract_demographics$percent_black
chicago_percent_black = tract_choropleth(df_chicago_tract_demographics,
                 state_name="illinois",
                 county_zoom=17031,
                 title="",
                 legend="Percent Black")

# place the maps side-by-side
double_map(chicago_percent_white,
           chicago_percent_black,
           title = "Racial Characteristics of Chicago Census Tracts\n2018 ACS")
Technical Details
To fully understand this change to choroplethr, you need to understand two things: where Choroplethr’s maps come from, and the development of the Simple Features format for storing map data.
Where Choroplethr’s maps come from
When Choroplethr was first released in 2014, there were a lot of problems with maps in R. For example, the maps package, which ships with R, contained a world map … that included the USSR. It also had a US County map that had errors. Also, I believe that none of the US maps in that package contained Alaska or Hawaii.
As a result of these limitations I created a new package, choroplethrMaps, that contains official US maps that come from the US Census Bureau. The choroplethr approach to mapping proved to be very popular, and people increasingly asked for me to add more maps to the package. As such, and through the generosity of my employer at the time, I created more packages with more maps. They all followed a similar format:
| Package | Map Variables | Metadata Variables | Mapping Functions | Notes |
|---|---|---|---|---|
| choroplethrMaps | state.map, county.map, country.map | state.regions, county.regions, country.regions | state_choropleth, county_choropleth, country_choropleth | US States and Counties, plus Countries of the world |
| choroplethrAdmin1 | admin1.map | admin.regions | admin_choropleth | Administrative subdivisions of each country of the world (e.g. prefectures of Japan) |
| choroplethrZip | zip.map | zip.regions | zip_choropleth | US ZIP Code Tabulation Areas, which serve as a proxy for ZIP Codes for US Census data. |
While this worked for a while, at some point there are just too many maps. For example, the national ZCTA map is 419 MB, which CRAN considers to be too large to host. (It is hosted on github instead). And the Census Bureau does not even release a national Tract map; rather they publish a separate one for each State. So if you wanted to package all the Tract maps, you would need 50 different packages. At some point, this approach simply doesn’t scale.
Enter Tigris
Kyle Walker, the author of the Tigris package, found a great way around this problem. Tigris uses the Census Bureau’s API to pull Census Tract maps on demand. This obviates the need to package maps at all, although you will likely still need to process and generate metadata on them (see ?zip.map and ?zip.regions for an example of this processing and metadata).
Behind the scenes, choroplethr’s ?tract_choropleth function uses the Tigris package to fetch the map you need on demand.
Simple Features
Choroplethr uses ggplot2 to render maps. When Choroplethr was first released in 2014, the only way ggplot2 could render maps was if they were in the Shapefile format. ggplot2 required you to read the Shapefile into R, convert it to a “fortified” data.frame, and then pass it that data.frame. Choroplethr stores all of its maps as “fortified” data.frames, so that ggplot2 can render the maps as quickly as possible.
Now R is moving away from Shapefiles to a new format called Simple Features. Tigris, with its latest version, made Simple Features the default format it returns from the Census API. This change broke Choroplethr’s ability to render Tract maps at all, because Choroplethr expected all maps to be in the old format.
In short, this change updated Choroplethr so it can render maps that are encoded as Simple Features.
Future Work
As the R mapping world continues to migrate to Simple Features, it would be nice to migrate all of the maps that Choroplethr uses to Simple Features as well. This would allow, among other things, me to start work on making Choroplethr produce interactive maps. While ggplot2 does not support interactive maps, the Leaflet package does. But Leaflet requires maps to be stored in Simple Features. (While leaflet can also render Shapefiles, it cannot render the “Fortified data.frames” that ggplot2 used to excusively require, and which choroplethr uses to store its data).
As the above table shows, Choroplethr has 5 maps stored in 3 packages. Most of them were modified / processed prior to import, and each of them also contains metadata that needs to be tested and possibly updated as a result of the change. The packages then need to be re-submitted to CRAN and summarized in a blog post. I also need to work with the maintainers of the packages that import these maps so that their packages do not break. I estimate this project to take about 3 weeks.
Choroplethr was originally creating during the “Innovation Weeks” at my previous employer. All employees had a full week each quarter to work on the project of their choice. If I was still at that company, then I would do this work over a few “Innovation Weeks”, as well as during any downtime I had between regularly scheduled projects.
But now that I am self employed, I am not sure if I can afford to take the time to make these changes. In fact, I am beginning to see how the maps package became outdated: finding funding to maintain and update an open source project is hard.
Choroplethr has over 175k total downloads, including over 3k in the last month. These numbers indicate that Choroplethr is widely used and valuable to the R community. While Choroplethr is popular, it is unfortunately now using outdated mapping technology. There is a clear path to address this, but it will require funding to make it a reality.
If you know of an organization that is able to fund this work, then please contact me.


