New Lesson: Mapping Historic Census Data in R
Today I am happy to announce a new lesson for my free email course Learn to Map Census Data in R. This lesson explains how to get and map historic census data in R. While I had intended this lesson to only go to new signups, it looks like my email provider sent it (along with resending the conclusion email!) to anyone who ever took the course. I apologize for this! For reference, here is the lesson:
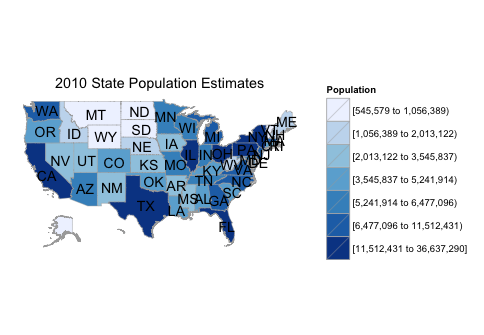
Exercise: Map the Population of US States in 2010.
In lesson 2 we used two objects to analyze state demographics:
- ?df_pop_state, which has data from the 2012 5-year America Community Survey (ACS)
- ?df_state_demographics, which has data from the 2013 5-year ACS
To get data from other years you need to access the US Census API. To do that:
- Fill out this form to get a Census API Key. They will email you a key.
- When you get your key, type the following in R:
library(acs)

api.key.install("<your key>")
We can now use the function ?get_state_demographics to get data from other surveys. For example, this code will get data from the 2010 5-year ACS:
library(choroplethr)

?get_state_demographics
df_2010_demographics = get_state_demographics(2010)
Creating a map of 2010 population estimates is now simple:
df_2010_demographics$value =
    df_2010_demographics$total_population

state_choropleth(df_2010_demographics,
    title = “2010 State Population Estimates”,
    legend = “Population”)
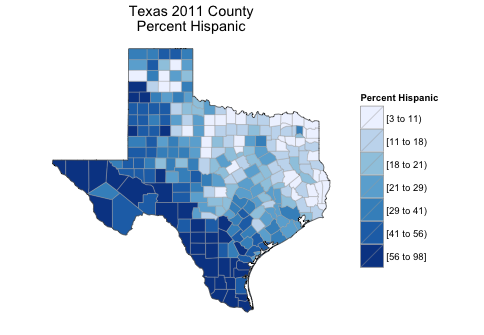
Exercise: Make a map showing the Percent Hispanic of Counties in Texas in 2011.
We will get the data with the function ?get_county_demographics, which works analogously to get_state_demographics:
df_2011_demographics = get_county_demographics(2011)

df_2011_demographics$value =
    df_2011_demographics$percent_hispanic

county_choropleth(df_2011_demographics,
    title      = "Texas 2011 County\nPercent Hispanic",
    legend     = "Percent Hispanic",
    state_zoom = "texas")
Homework: Use the function ?get_zip_demographics to make a map of some demographic in San Francisco County (FIPS code 6075) in 2011. get_zip_demographics is in the package choroplethrZip. Tweet the resulting image to me (@AriLamstein) with the hashtag #censuscourse.


